
 Dataset description
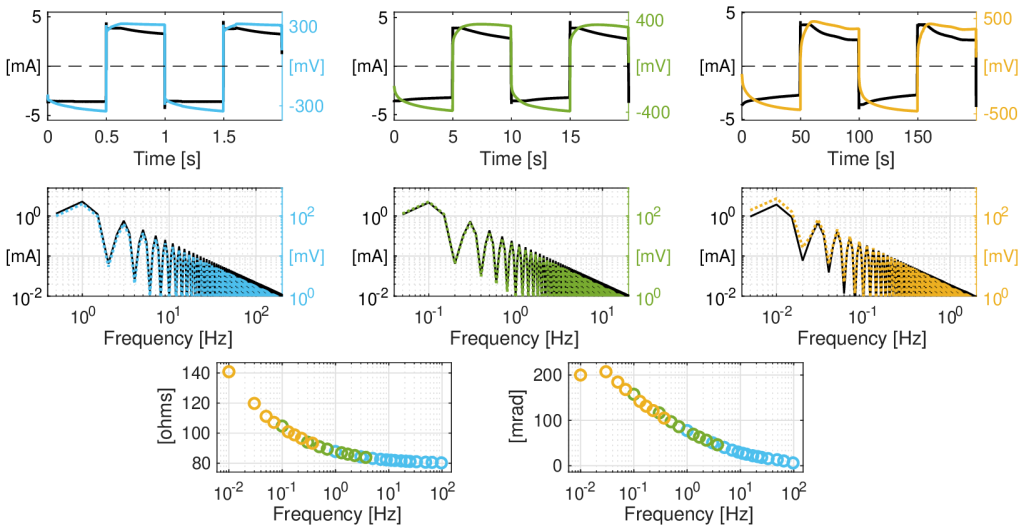
Dataset of spectral induced polarization measurements collected in the wetland area at the Ploemeur-Guidel hydrogeological observatory, to monitor reactive processes with high spatial resolution across the top meter of soil (Figure 1). The spectral content of a signal with line spectrum resulting from square-wave current is exploited by injecting successively three square-wave currents with periods of 1, 10 and 100 s, covering the frequency range of 0.01 to 100 Hz in less than 4 minutes. One dataset consists of eight successive current injections at different depths. For each current injection, the electrical potential is simultaneously measured at seven dipoles. The time-series are recorded with a 2 kHz sampling rate, allowing to calculate by Fourier transform the amplitude and phase spectra for each quadrupole. Details can be found in the corresponding paper.
The DOI includes a raw dataset collected in 2025 and the Matlab code for calculating complex conductivity spectra from these data. They can be downloaded from the link provided below. The full dataset of the Guidel site is available here.
 Download link
| Dataset |
|---|
| Raw data and Matlab code: link |
 Acknowledgements
Fundings: UMR 6118 Géosciences Rennes
Contributors:
- Florence Nicollin, UMR 6118 Géosciences Rennes, Université de Rennes, France.
- Bruno Kergosien, UMR 6118 Géosciences Rennes, Université de Rennes, France.
- Léa Lévy, UMR 6118 Géosciences Rennes, Université de Rennes, France.
- Laurent Longuevergne, UMR 6118 Géosciences Rennes, Université de Rennes, France.
- Damien Jougnot, UMR 7619 METIS, Sorbonne Université, France.